Accessing cPanel
- Open your web browser and enter your domain followed by /cpanel. For example, www.yourdomain.com/cpanel.
- Enter your username and password to log in.
Viewing Website Statistics
cPanel offers multiple tools to view website statistics. The most common ones are Awstats, Webalizer, and Analog Stats. Each provides a different level of detail and presentation format.
Using Awstats
- In the cPanel home screen, scroll down to the Metrics section.
- Click on the Awstats icon.
- If you have multiple domains, select the one you want to view stats for.
- Awstats will display a detailed report of your website’s statistics. This includes unique visitors, number of visits, pages, hits, bandwidth usage, and more.
Using Webalizer
- In the Metrics section of the cPanel home screen, click on the Webalizer icon.
- Choose the domain you wish to view.
- Webalizer presents data in graphical form. You can see information like daily and monthly stats, top URLs, top entry and exit pages, and more.
Using Analog Stats
- In the Metrics section, click on the Analog Stats icon.
- Select the domain for which you want to see the stats.
- Analog Stats provides simple and basic statistics. It includes monthly, daily, and hourly reports.
Using Bandwidth
- In the Metrics section, click on the Bandwidth icon.
- This tool shows you the bandwidth usage of your site. It’s useful for monitoring data transfer and understanding peak traffic times.
Using Metrics Editor (if available)
- In the Metrics section, click on the Metrics Editor icon.
- This allows you to enable or disable specific stats programs like Awstats, Webalizer, and Analog.
Understanding Key Metrics
- Unique Visitors: The number of distinct individuals visiting your site.
- Visits: The total number of times your site is accessed.
- Pages: The number of pages viewed on your site.
- Hits: The total number of files (including pages, images, scripts) requested from your site.
- Bandwidth: The total amount of data transferred from your site.
Conclusion
Monitoring your website statistics in cPanel is crucial for optimising your site and enhancing user experience. By regularly reviewing your stats through tools like Awstats, Webalizer, and Analog Stats, you can gain valuable insights into your website’s performance, user behaviour, and traffic patterns. This information can help you make informed decisions about your content, marketing strategies, and overall site management.
This demo assumes you’ve already logged in to cPanel
Now let’s learn how to view our website stats
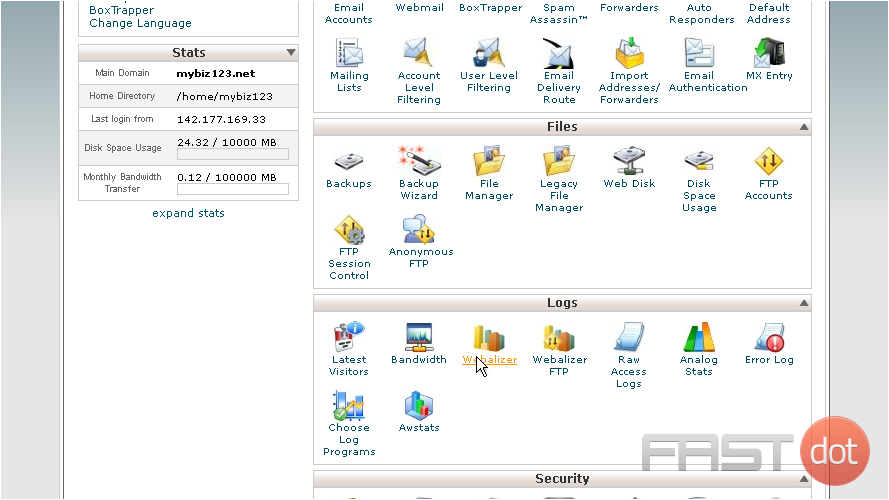
1) Click the Webalizer icon
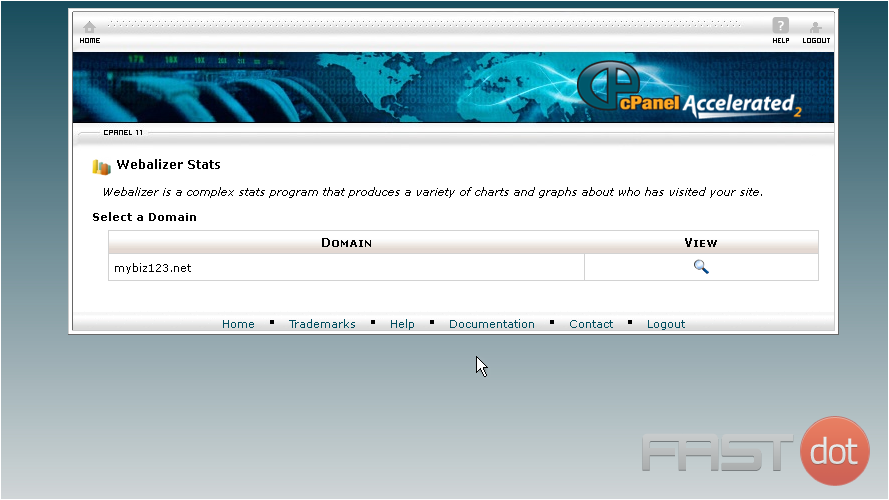
2) Then click the View icon
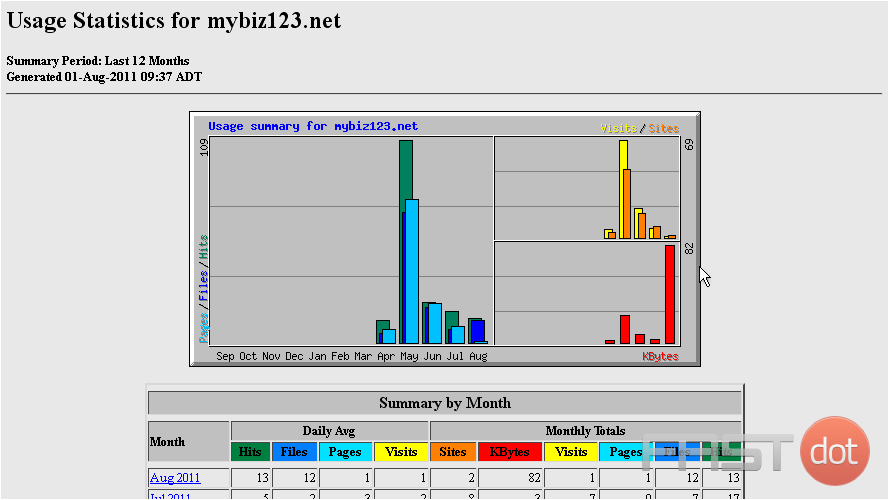
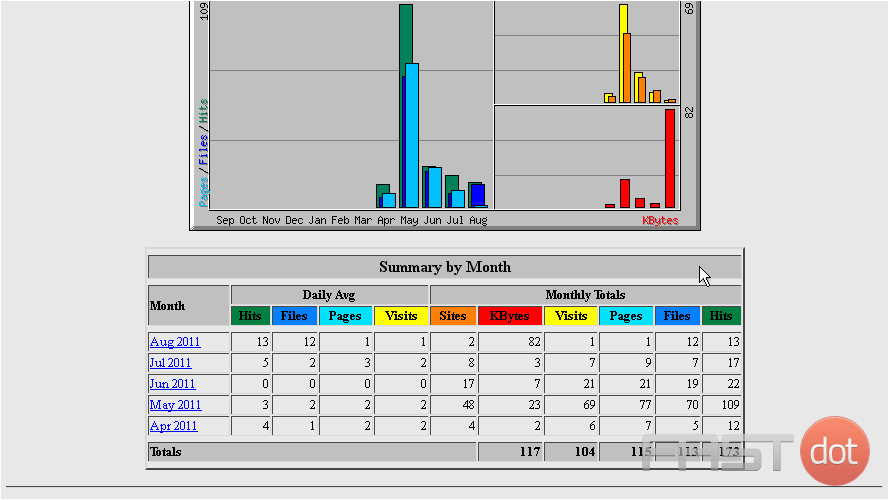
This is the main Webalizer page, from where you can access visitor stats broken down in several different ways
3) You can view usage stats of a particular month
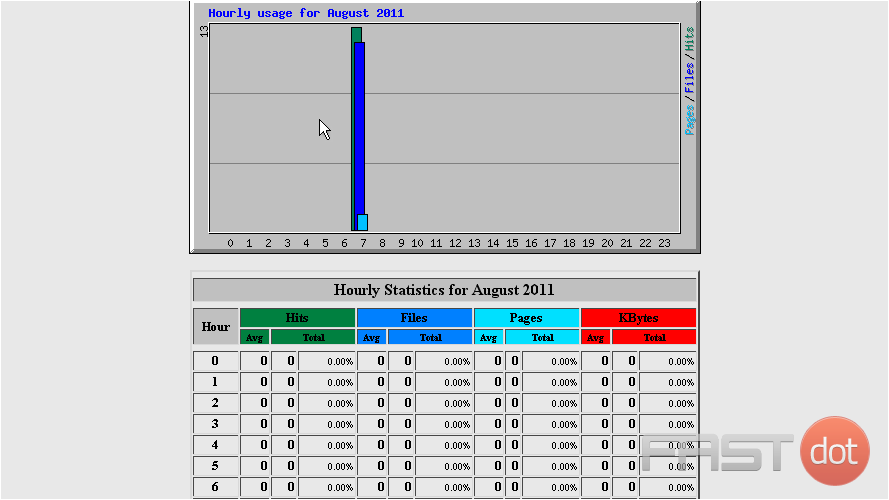
4) … and within that month you can for example, view the hourly stats
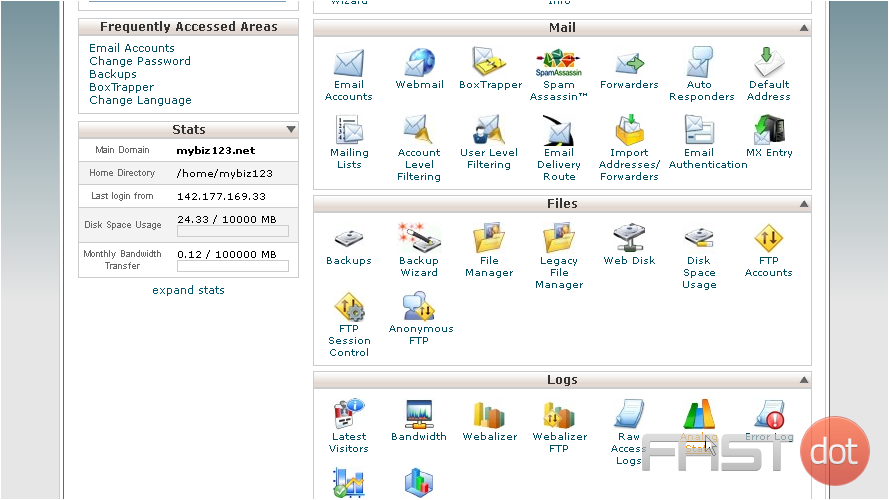
5) Instead of using Webalizer, you can view the Analog stats
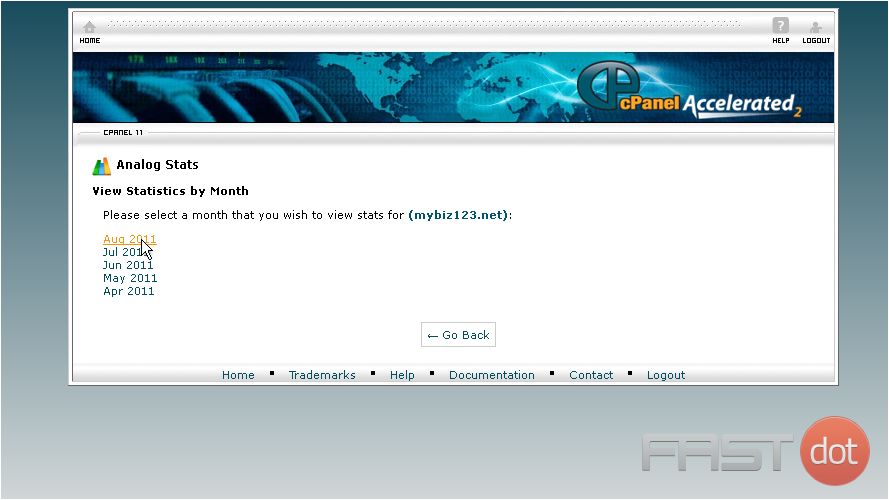
6) Choose a month to view the stats
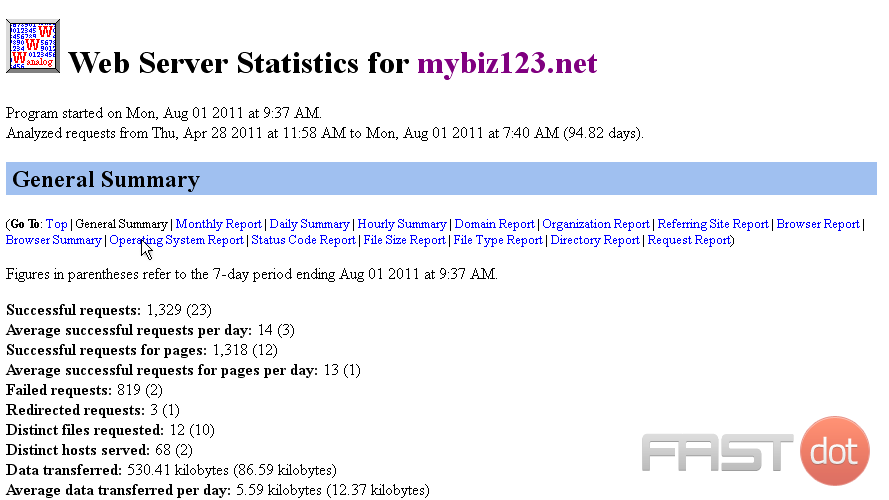
7) From here you can view usage stats in many different ways as well
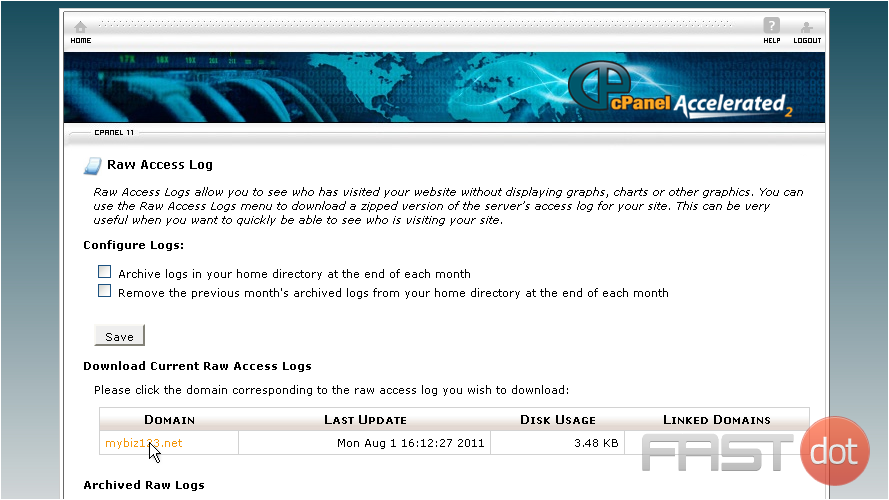
8) Another option is to download the Raw Access Logs
Downloading these logs will allow you to analyze the usage data with your own data analysis application
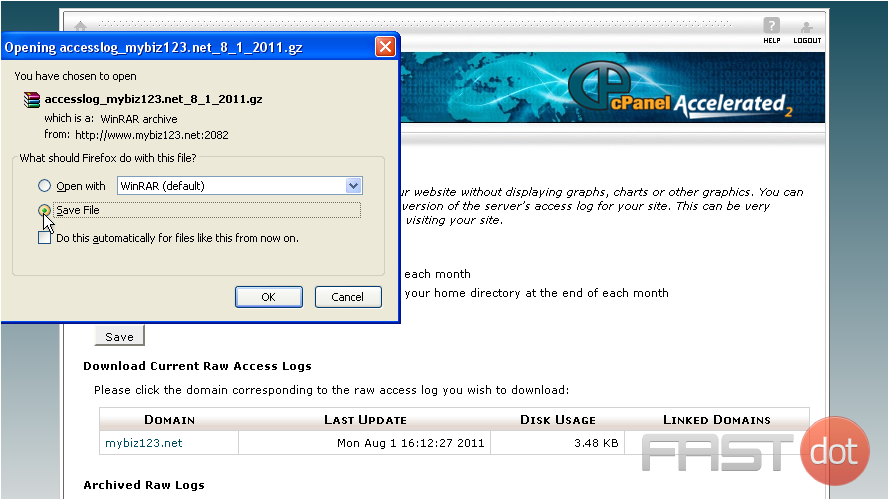
9) Click the domain to start the download
10) Click Save File, then click OK
That’s it! The raw data has been saved to our computer
This is the end of the tutorial. You now know how to access your website statistics, and download the raw access logs for later analysis
Do you have any questions? Ask us in the forums →

